14 Jun 2026
Streaming Platform Algorithms Reveal Patterns in Viewer Interaction Data
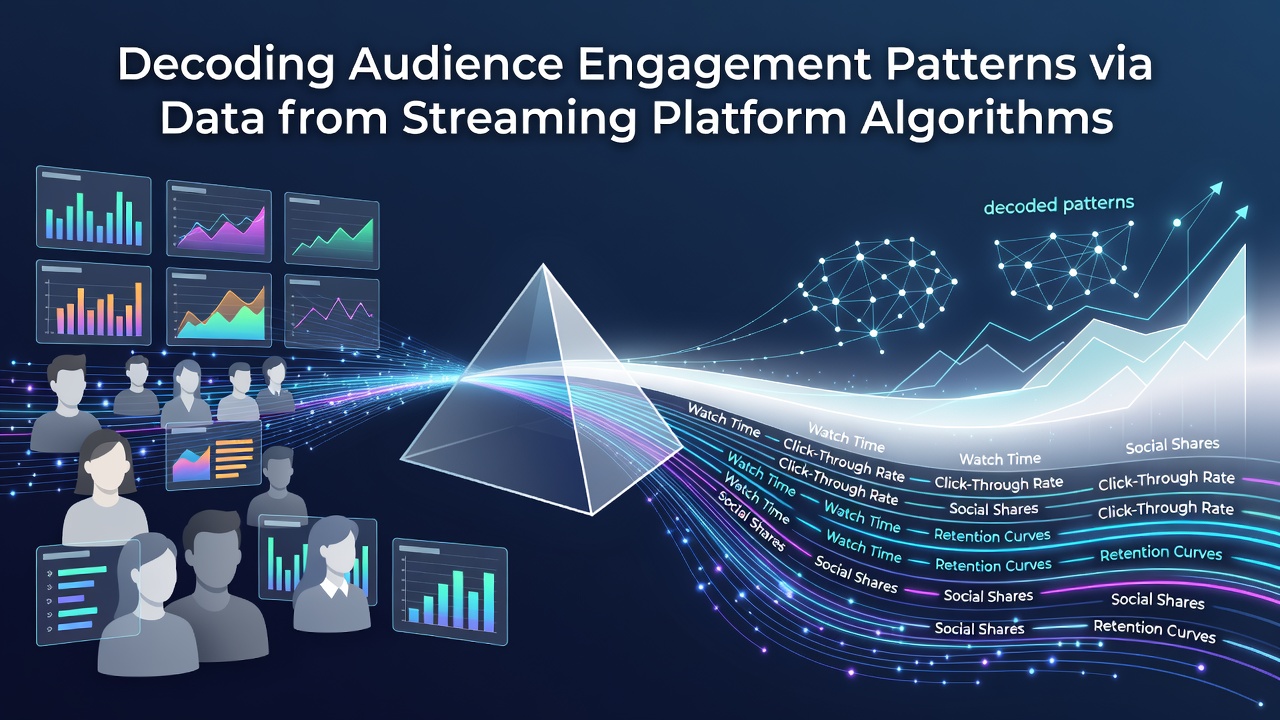
Streaming services collect vast amounts of interaction data from users, and algorithms process these signals to identify engagement patterns that include completion rates, session lengths, and content preferences across different demographics. Observers note that platforms like Netflix and Disney+ track metrics such as pause frequency, rewind actions, and device switching to build detailed profiles of how audiences consume media, while regulatory frameworks in multiple regions shape what information companies can retain and analyze.
Core Metrics That Algorithms Process
Play duration stands as a primary indicator since longer uninterrupted viewing sessions signal higher engagement levels, and algorithms compare these figures against historical averages for similar titles to flag potential drop-off points early in a program. Researchers at institutions including the University of Melbourne have documented how completion percentage data, when aggregated, highlights narrative elements that retain attention through mid-season episodes, yet shorter attention spans appear in mobile viewing logs collected during commute hours.
Additional signals include search queries entered before playback begins and the speed at which users skip intros or credits, both of which feed into recommendation engines that adjust suggestions in real time. Data from industry reports shows these combined inputs allow platforms to segment audiences into groups that favor serialized storytelling versus standalone episodes, creating more precise targeting without relying on self-reported surveys.
Regional Regulatory Influences on Data Collection
June 2026 brought updated guidance from the Australian Communications and Media Authority that clarified consent requirements for cross-border data transfers used in engagement modeling, prompting several platforms to refine their logging practices while maintaining analytical capabilities. Similar adjustments occurred under Canadian oversight bodies, where emphasis on transparency led companies to publish summaries of the variables their systems weigh most heavily during pattern detection.
These changes illustrate how legal standards intersect with technical processes, since algorithms must now account for anonymized datasets that still preserve enough granularity to detect trends like seasonal spikes in documentary viewing among older demographics. Observers note that compliance costs have risen, yet the core ability to map retention curves remains intact across major services.
Advanced Pattern Detection Techniques
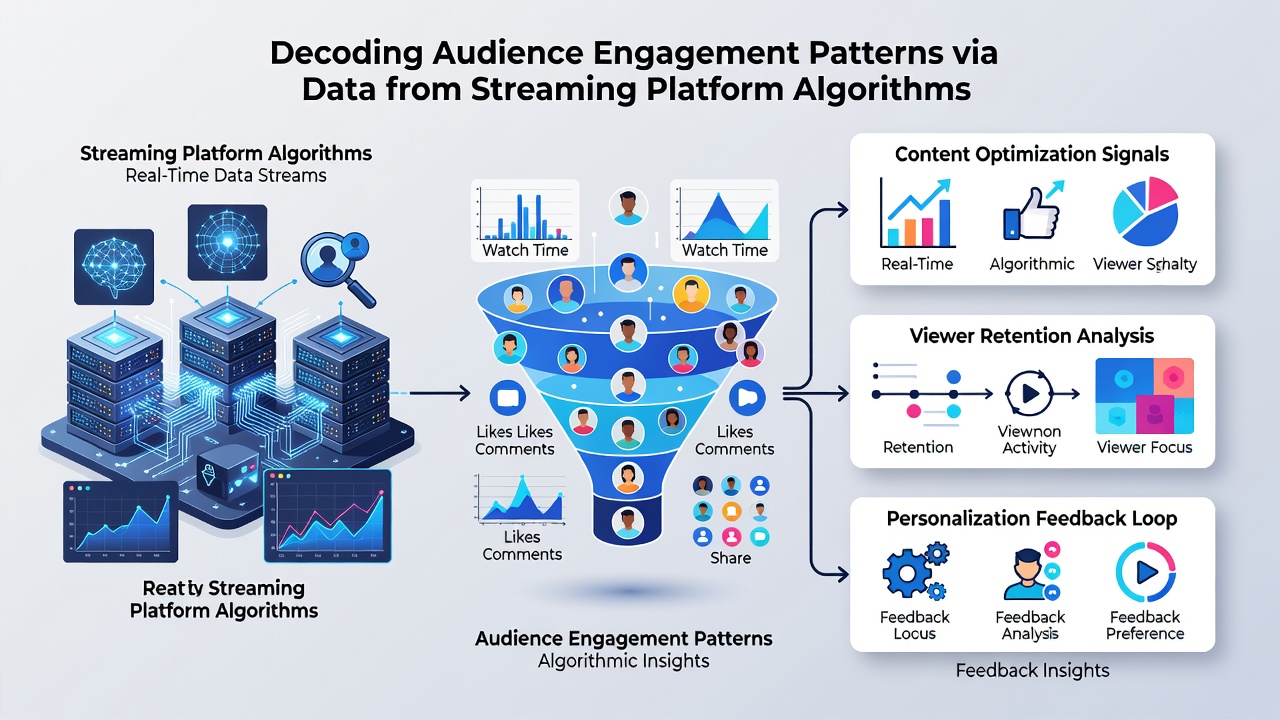
Machine learning models examine sequences of interactions rather than isolated events, and this approach uncovers correlations such as increased rewinding during complex plot twists that later correlate with higher rewatch rates for entire seasons. One study conducted by analysts affiliated with the European Data Protection Board examined aggregated logs and found that users who adjust subtitles frequently tend to finish foreign-language content at rates comparable to native productions, a finding that influenced dubbing investment decisions at several studios.
But here's the thing: context matters because time-of-day patterns differ sharply between weekday and weekend data streams, leading algorithms to weight evening binges more heavily when predicting long-term subscription value. Platforms apply these insights to A/B testing frameworks that present variant thumbnails or episode orders to subsets of users, measuring subsequent engagement shifts without disrupting overall service performance.
Case Examples from Industry Practice
Take the instance where a major platform adjusted its recommendation weightings after reviewing data showing elevated exit rates during slow-burn opening acts of prestige dramas, and subsequent interface changes directed viewers toward curated playlists that improved average session duration by measurable margins. Another analysis traced how mobile notifications timed to cliffhanger moments increased return visits, though only when sent within a narrow window after initial playback ended.
Those who've examined these systems understand that geographic variations appear clearly in the datasets, since viewing habits in urban areas show more fragmented sessions compared with suburban logs that reflect longer uninterrupted blocks. Industry organizations such as the Motion Picture Association have compiled reports that aggregate anonymized figures across services, revealing consistent patterns around holiday viewing surges that algorithms now anticipate through seasonal model retraining.
Conclusion
Algorithms continue to evolve their interpretation of engagement signals as new data streams emerge from interactive features and expanded device ecosystems, while regulatory environments across regions maintain pressure for responsible handling of user information. The resulting insights shape content acquisition strategies and interface designs that respond directly to observed behaviors rather than assumptions, creating feedback loops that refine pattern detection over successive updates.